Has anyone done an updated analysis of player plane profits? For example, which planes in each category (M/L really) are most profitable taking into account revenue and fuel consumption.
I have a bunch of planes coming up on Maint C and am trying to figure out what my new fleet will look like. I tend to do longer routes to farm SP.
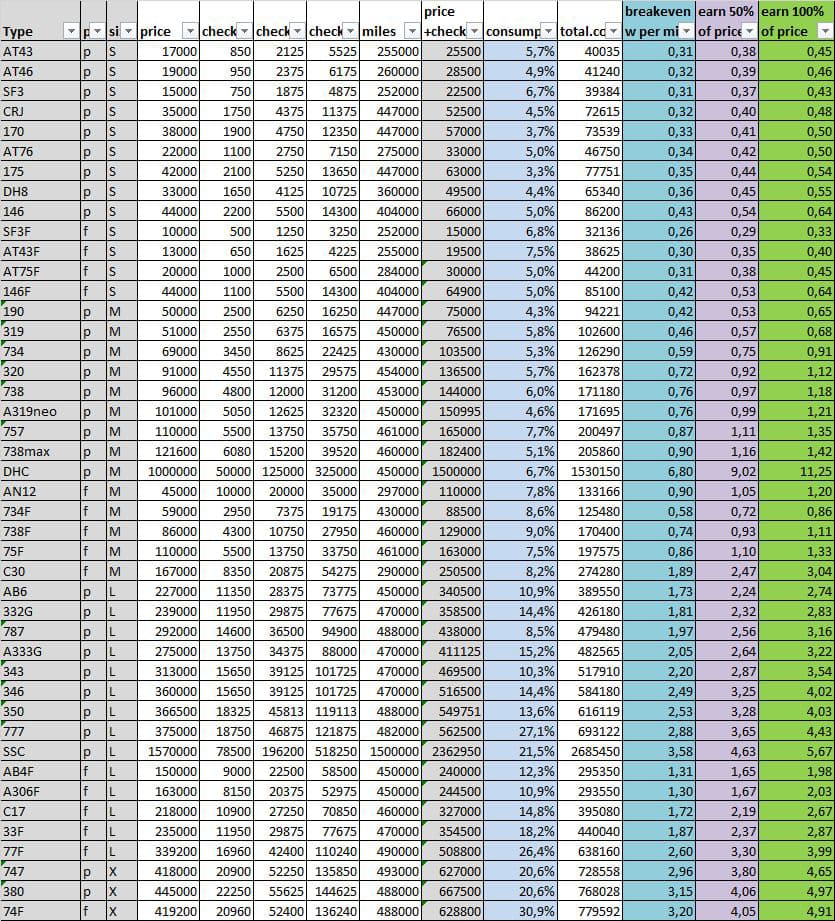
example for B757: if you fly routes where the distance divided by the revenue is >= 0.87 than you make a breakeven in the end (and get 200 SP) - [blue column]
If you fly routes where the factor is = 1.35 the total revenue at the end will be the price you paid for the B757 [green column]
What do you mean by “breakeven” and “earn 100%”? I don’t understand the difference between the two.
Do you mean at breakeven you will have earned the amount you paid for the plane + maintenances? At 100% you will have earned twice the amount?
MCT-HKT
B757
2478 / 2775 = 0,893
when it get for D, it earn like 169k-170k
MCT-DAR
B734
2143/1883 = 1,14
And this give like 142k-145k
that’s it’s look.
With ‘breakeven’ I ment that you will have earned the price you paid for the plane and for maintenance. No additional money earned but no money lost. And 200 SP gained.
‘100%’ means you will have the price you paid for the plane as additional money.
You asked for consumption information, therefore I posted the table.
The profitability depends on the length of the routes you fly, would need a third dimension in the table
Well, then there’s something wrong with the table. With cargo planes I earn more the shorter the routes.
For example: The A332F LEJ > FRA
= 161 nm / 6401 ₩ makes after what I read in this thread a factor of 0.02.
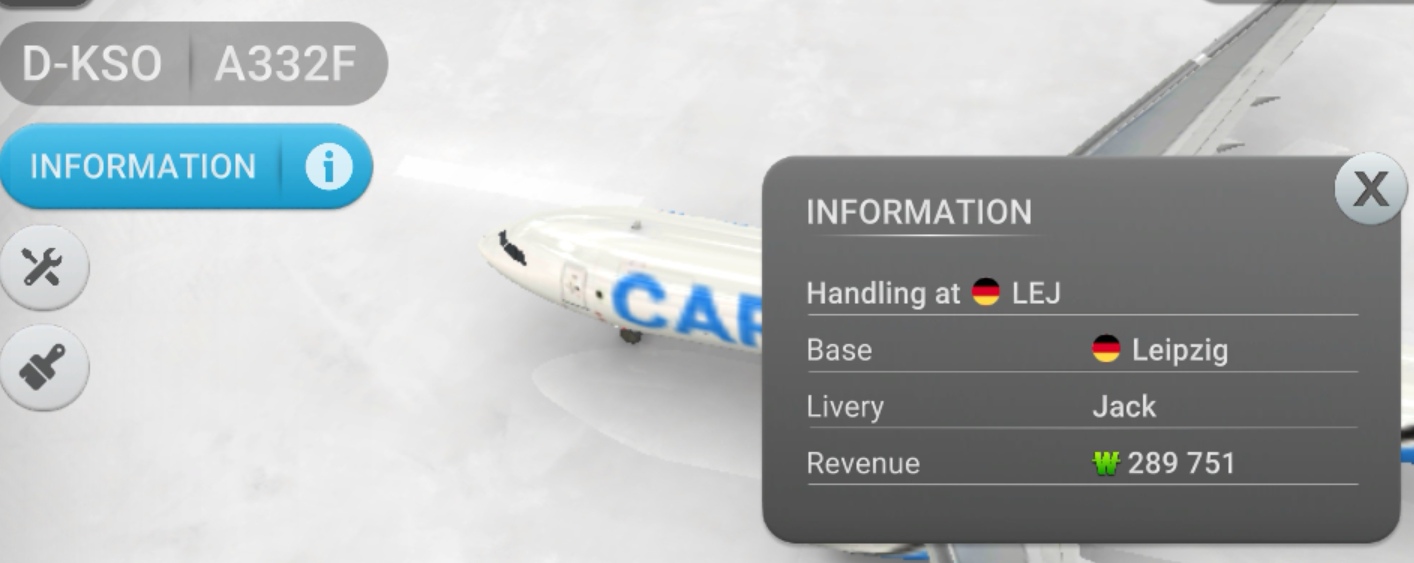
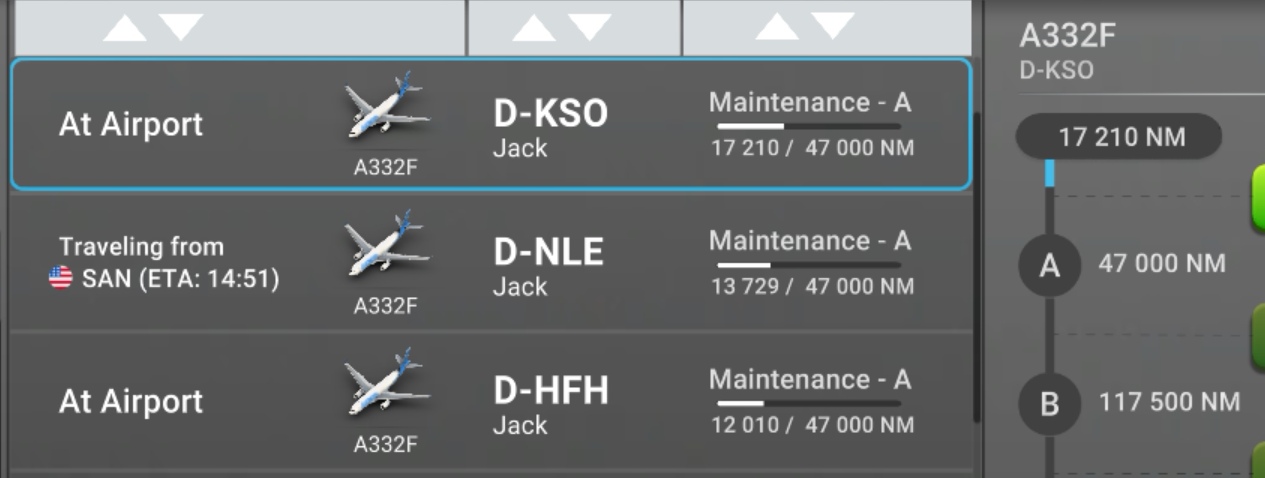
As example one of my A332F in LEJ.
After Just 17k nm it already earned almost 290k ₩. That’s already more than you buy it for and I’ll get more than double it’s price before maintenance A. That doesn’t fit to your table.
The table is NOT about revenues per route! Every route ist different. It’s about cost for consumption, maintenance and shopping costs. These are not connected directly to the route length. It was done to prevent me from flying routes where you only burn money. All your examples are correctly figured, but the scope of the table is another. If you fly short routes with the A332F you are definitely on the money-making side. But you have to take in account that it is a return-trip, you therefore have to multiply the distance by 2 in your example.
Again: I put the table here as answer to the question about consumption only.
You can’t blame a strawberry for not tasting like a banana…
Thanks for the table. Maybe I should rephrase this to simplify it. Which planes are the most profitable assuming they’re all operating on the same route? Would the higher the number in the green column be better?
It’s the other way round, the comet (DHC) is the most unprofitable plane. The lower the numbers in the blue, purple an green columns the more money you earn In RELATION compared to your investment. The total revenue depends on how many passengers or how much freight one plane can transport. This total revenue is NOT part of this table.